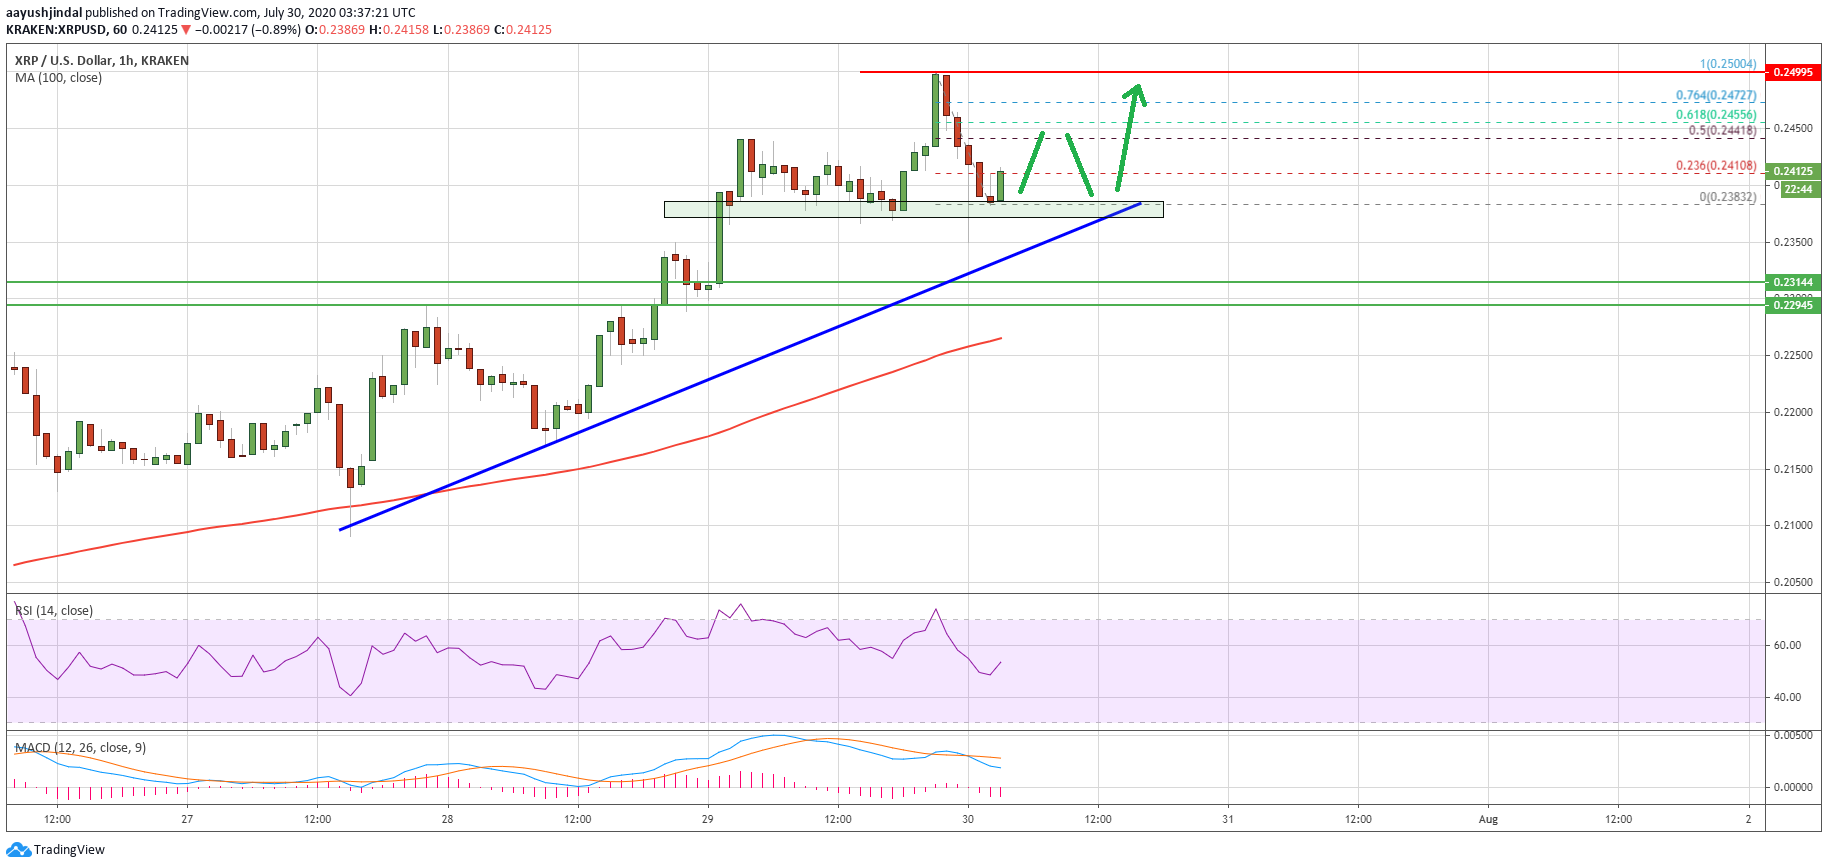
Ripple extended its upward move towards the $0.2500 resistance against the US Dollar. XRP price is currently consolidating gains above $0.2400 and it might start another increase.
- Ripple gained bullish momentum above the $0.2400 and $0.2420 resistance levels against the US dollar.
- The price traded to a new monthly high at $0.2500 and settled well above the 100 hourly SMA.
- There is a key connecting bullish trend line forming with support near $0.2380 on the hourly chart of the XRP/USD pair (data source from Kraken).
- The pair is consolidating gains and it might start a fresh increase unless it breaks the $0.2300 support.
Ripple Price Holding Gains
Yesterday, we discussed the chances of more upsides in ripple above the $0.2400 resistance. XRP price did gain traction above the $0.2420 resistance and it remained well above the 100 hourly simple moving average.
The upward move was such that the price broke the $0.2450 level and it tested the $0.2500 resistance (as discussed in yesterday’s analysis). Recently, there was a downside correction below the $0.2450 and $0.2420 levels.
The price even traded below the $0.2400 level, but it is finding strong bids near the $0.2380 support. The recent low was formed near $0.2383 and the price is currently consolidating gains. An initial resistance is near the $0.2410 level.
Ripple price holds $0.2380. Source: TradingView.com
The 23.6% Fib retracement level of the recent decline from the $0.2500 high to $0.2383 low is also near $0.2410. The first major resistance on the upside is near the $0.2440 level since it coincides with the 50% Fib retracement level of the recent decline from the $0.2500 high to $0.2383 low.
It seems like there is a key connecting bullish trend line forming with support near $0.2380 on the hourly chart of the XRP/USD pair. If the pair stays above the trend line, it could start a fresh increase above $0.2440 and $0.2450.
The main hurdle is now near the $0.2500 resistance zone. A successful break above the $0.2500 level may perhaps lead the price towards the $0.2560 and $0.2580 levels in the near term.
Downside Break in XRP
The trend line support holds the key for ripple near $0.2380. If there is a downside break below $0.2380, the price may perhaps extend its decline towards the $0.2320 level.
The main support is near the $0.2300 level (the last breakout zone), below which the bears are likely to aim a larger correction wave towards the $0.2200 level.
Technical Indicators
Hourly MACD – The MACD for XRP/USD is gaining pace in the bearish zone.
Hourly RSI (Relative Strength Index) – The RSI for XRP/USD is just above the 50 level.
Major Support Levels – $0.2380, $0.2320 and $0.2300.
Major Resistance Levels – $0.2410, $0.2440 and $0.2500.
Take advantage of the trading opportunities with Plus500
Risk disclaimer: 76.4% of retail CFD accounts lose money.
from NewsBTC https://ift.tt/2CS2qhS

