Bitcoin has seen a tumultuous past few days after reaching as high as $11,500 on Monday. In the past 48 hours alone, the asset has whipsawed between $10,600 and $11,400, with bulls and bears attempting to catalyze a range breakout.
Both sides have failed thus far; as of the time of this article’s writing, BTC remains in the middle of the local range at $11,000.
Related Reading: Crypto Tidbits: Ethereum Surges 20%, US Banks Can Hold Bitcoin, DeFi Still in Vogue
It may seem that BTC is in no man’s land, but a trader has argued that as long as $10,800 is held, a bullish bias can be held.
Bitcoin Must Hold $10,800 to Hold Bullish Bias: Analyst
According to analyst Edward “Teddy” Cleps, Bitcoin holding $10,800 on the four-hour chart will confirm the short-term bull case.
Cleps cites his custom Secret EMA Cloud, which indicates important technical levels and trends. The indicator accurately predicted the surge from $9,400 to $11,500 last week when BTC broke above the cloud, causing it to flip green.
Bitcoin holding the cloud’s upper boundary in the days ahead should confirm that the uptrend is intact.
The cloud’s upper boundary, denoted by the black line on the chart below, should continue to move towards BTC’s current price as it is an exponential moving average.
Chart of BTC's recent price action with a custom cloud indicator by Edward "Teddy" Cleps (@Teddycleps on Twitter). Chart from TradingView.com
Another level of importance that traders are watching is $10,500.
$10,500 is a level of macro importance for Bitcoin. It marked the top of a BTC rally on three separate occasions: once in October 2019, once in February 2020, and once in June 2020.
To some commentators, BTC must hold above $10,500 when the one-month candle closes in approximately 20 hours after this article’s publishing time.
And according to many analysts, it’s highly probable that it holds.
$12,000 Is Imminent
With the uptrend still intact, analysts are trying to postulate what comes next for BTC.
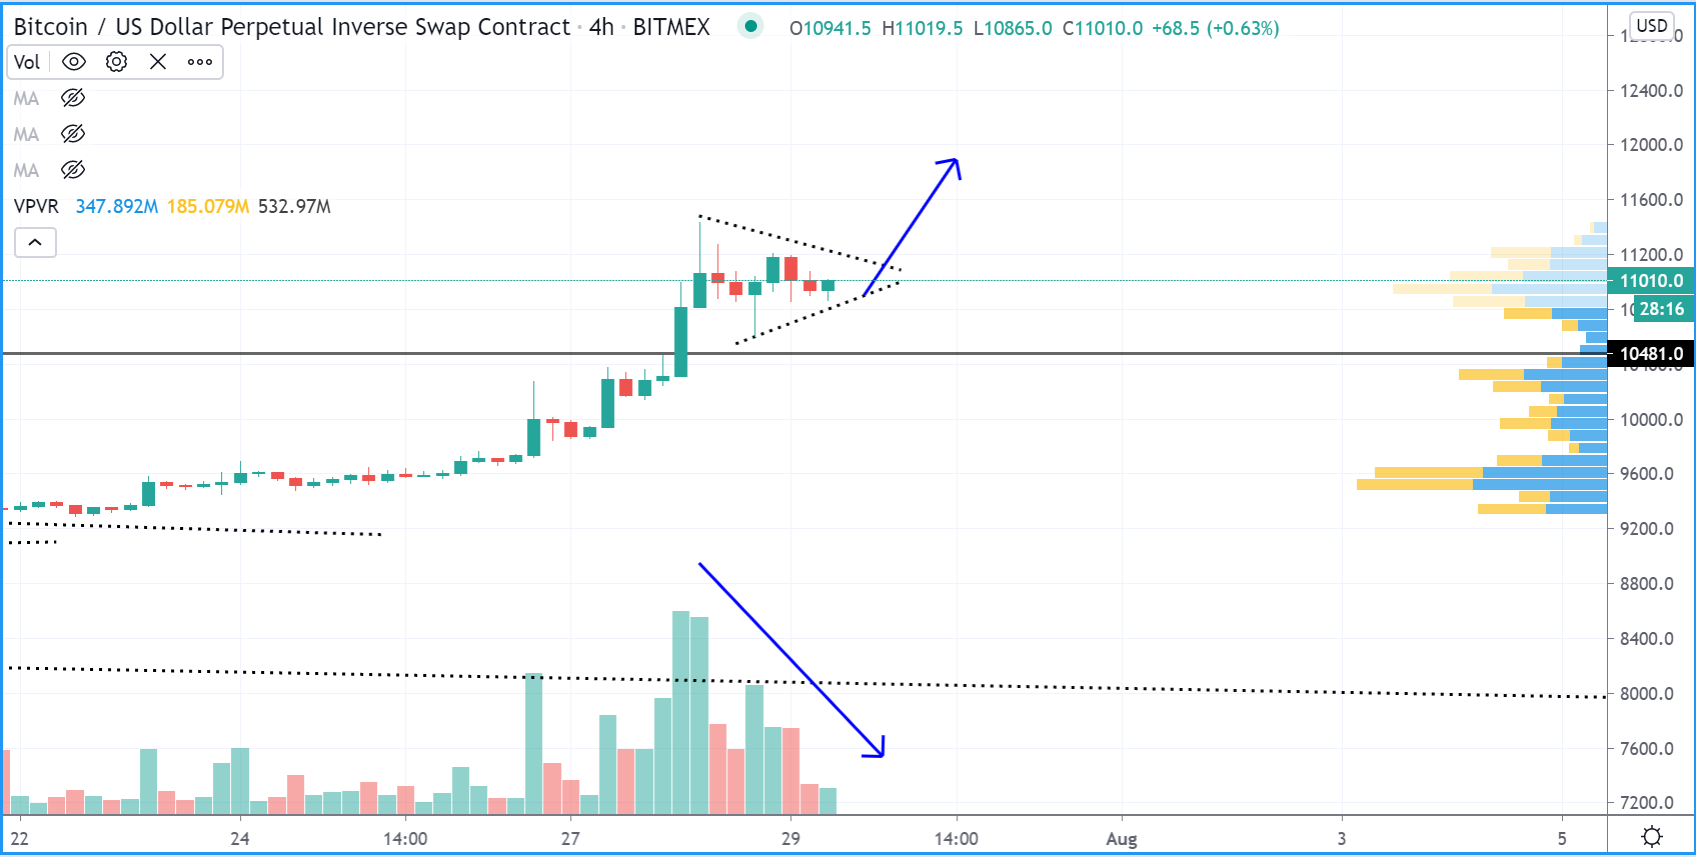
According to the pseudonymous trader who predicted Bitcoin would bottom 2018’s bear market at $3,200, a move to $12,000 is likely. As reported by NewsBTC previously, this trader wrote in reference to the chart below:
“$btc consolidating above a pretty key breakout level. price contracting, volume declining, seems bullish, continuation soon.”
Chart of BTC's recent price action by trader SmartContracter (Twitter handle). Chart from TradingView.com
What investors do have to watch out for, though, is the high funding rates of Bitcoin and crypto perpetual swaps.
Perpetual swaps are a type of futures contract that is popular in the cryptocurrency industry. Funding is the fee that long positions pay short positions to keep the price of the future close to the price of the underlying asset.
High funding rates often suggest that buyers of perpetual swaps are overextended, leading to short-term corrections where the funding rate normalizes.
Related Reading: On-Chain Metric Signals the BTC Market Isn’t Overheated: Why This Is Bullish
Featured Image from Shutterstock
Price tags: btcusd, xbtusd, btcusdt
Charts from TradingView.com
Bitcoin Must Hold $10,800 to Maintain Bullish Bias—But Will It?
from NewsBTC https://ift.tt/2XbR2UX


