Bitcoin has acted weak over the past few days, falling as low as $8,950 as touching $9,800 on Monday. Yet there are technical signals suggesting that a bull trend is soon to appear.
One signal that was last seen at the start of the March crypto rally is about to appear again. And that’s good for the bull case.
Related Reading: Crypto Tidbits: Bitcoin At $9k, Grayscale Ethereum Trust, Cryptocurrency & PayPal
Bitcoin Is Flashing Some Bullish Signs Despite Retracement Fears
The Stochastic relative strength index (Stoch RSI) has long been a leading signal in technical analysis. As Investopedia explains, the Stoch RSI “gives traders an idea of whether the current RSI value is overbought or oversold.”
The indicator has been rather accurate in predicting Bitcoin’s price action over the past few years. The one-week Stoch RSI flipped bearish just a week or two after the $14,000 peak in 2019, predicting the 60% crash that followed.
The same indicator also flipped bullish in December, preceding the ~40% rally to $10,500.
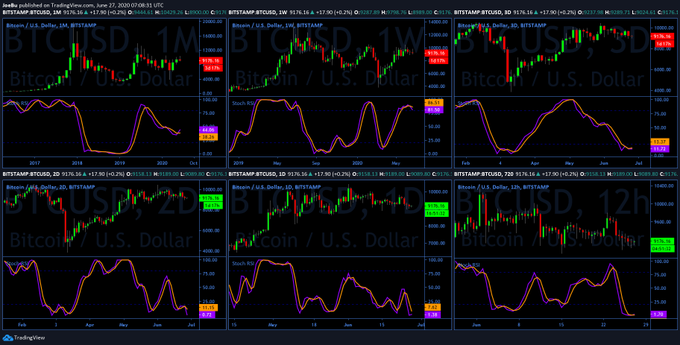
An analyst has now observed that the Stoch RSI on the 12-hour, one-day, two-day, and three-day is flipping bullish:
“12h, 1D, 2D and 3D are over-sold and look like they want to reverse while monthly also is turning bullish!”
Stoch RSI analysis across many of Bitcoin's time frames by analyst "JB" (@blackswan0815 on Twitter). Charts from TradingView.com
The three-day Stoch RSI is especially important as a bullish cross was last seen days after March’s crash to $3,700. Not to mention, another one of these crosses is about to take place.
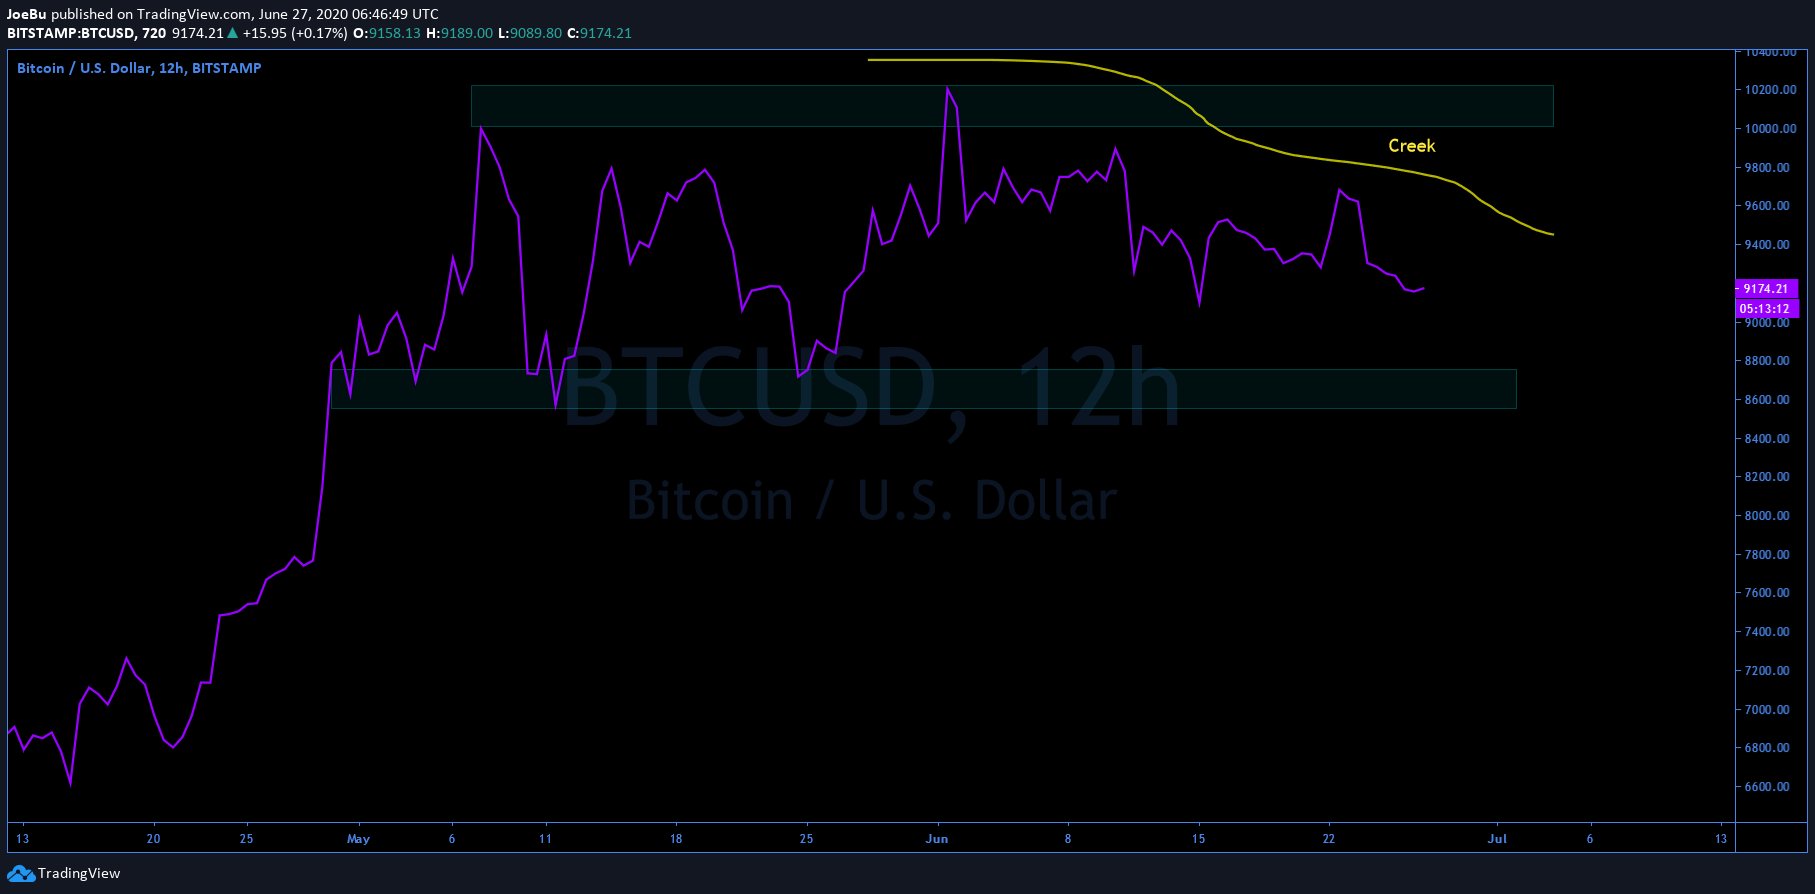
Adding to the bull case, the same analyst also shared the chart below.
It shows that Bitcoin is potentially forming a Wyckoff Re-Accumulation rather than a Wyckoff Distribution. BTC playing the Wyckoff Re-Accumulation scenario will mean the cryptocurrency is about to enter another bull trend. It will likely bring BTC towards $12,000 and beyond considering the proportions of the consolidation over recent weeks.
Wyckoff analysis by analyst "JB" (@blackswan0815 on Twitter). Charts from TradingView.com
Not the Only Bull
The analyst that shared the charts above is in good company. There is a confluence of other firms and analysts that are bullish on the leading cryptocurrency.
Bloomberg’s senior commodity analyst Mike McGlone recently released a report about Bitcoin.
In that report, the analyst said that “something needs to go wrong” for the leading cryptocurrency not to appreciate. This was made in reference to the asset’s perfect storm of macro, technical, and on-chain trends signaling increased adoption and higher prices.
McGlone doubled down on his optimism in a recent tweet, published June 26th. In it, he said that BTC is almost like a “caged bull” eyeing a breakout to $13,000 in the coming weeks.
Related Reading: Silk Road’s Ross Ulbricht Brands Ethereum’s MakerDAO a “Cool Concept”
Featured Image from Shutterstock
Price tags: xbtusd, btcusd, btcusdt
Charts from TradingView.com
Bitcoin Last Flashed This Signal at $3,700. It's Back Again
from NewsBTC https://ift.tt/31irybj


